Page 140 - BSR17-EN
P. 140

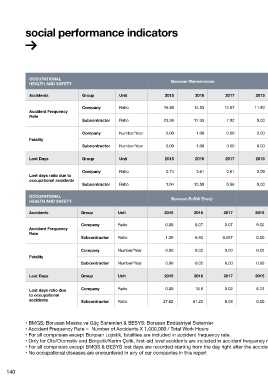
social performance indicators


              OCCUPATIONAL
                                                                             Borusan Mannesmann                            Borçelik                               Kerim Çelik                             Oto/Otomotiv
              HEALTH AND SAFETY
              Accidents               Group           Unit                2015          2016         2017          2015         2016         2017          2015         2016          2017         2015          2016         2017

                                      Company         Ratio               16.80        14.53         12.87        11.90         11.65        15.13        51.70         25.67        24.82          4.60         2.58          1.90
              Accident Frequency
              Rate
                                      Subcontractor   Ratio               23.59        17.33          7.92         0.00          0.00        13.58         0.00          0.00         0.00          0.00         0.00          0.00

                                      Company         Number/Year          0.00         1.00          0.00         0.00          0.00         0.00         0.00          0.00         0.00          0.00         0.00          0.00
              Fatality
                                      Subcontractor   Number/Year          0.00         1.00          0.00         0.00          0.00         0.00         0.00          0.00         0.00          0.00         0.00          0.00


              Lost Days               Group           Unit                2015          2016         2017          2015         2016         2017          2015         2016          2017         2015          2016         2017

                                      Company         Ratio                0.74         3.61          0.61         0.09          0.19         0.27         0.49          0.67         0.89          0.12         0.04         0.025
              Lost days ratio due to
              occupational accidents
                                      Subcontractor   Ratio                1.04        10.59          0.56         0.00          0.00         0.05         0.00          0.00         0.00          0.00         0.00          0.00

              OCCUPATIONAL
                                                                             Borusan EnBW Enerji                         Borusan CAT                            Borusan Lojistik                            Supsan
              HEALTH AND SAFETY
              Accidents              Group           Unit                 2015         2016         2017          2015          2016          2017         2015         2016          2017         2015          2016         2017


                                     Company         Ratio                 0.00         0.07         0.07          9.00          0.97        12.40         0.73          1.10         5.01          8.15        18.10         14.35
              Accident Frequency
              Rate
                                     Subcontractor   Ratio                 1.39         6.90        0.087          0.00          0.00         0.00        11.89         11.42        19.59          0.00         0.00          0.00


                                     Company         Number/Year           0.00         0.00         0.00          0.00          0.00         0.00         0.00          1.00         0.00          0.00         0.00          0.00
              Fatality
                                     Subcontractor   Number/Year           0.00         0.00         0.00          0.00          0.00         0.00         0.00          1.00         0.00          0.00         0.00          0.00


              Lost Days              Group           Unit                 2015         2016         2017          2015          2016          2017         2015         2016          2017         2015          2016         2017


                                     Company         Ratio                 0.00         18.8         0.02          6.23          0.07         0.19        0.052         0.132        1.660         0.024        0.021       0.00592
              Lost days ratio due
              to occupational
              accidents              Subcontractor   Ratio                27.82        81.20         0.08          0.00          0.00         0.00        1.020         0.819        1.840          0.00         0.00         0.000


            • BMGS: Borusan Makina ve Güç Sistemleri & BESYS: Borusan Endüstriyel Sistemler
            • Accident Frequency Rate =  Number of Accidents X 1,000,000 / Total Work Hours
            • For all compnaies except Borusan Lojistik, fatalities are included in accident frequency rate.
            • Only for Oto/Otomotiv and Borçelik/Kerim Çelik, first-aid level accidents are included in accident frequency rate.
            • For all compnaies except BMGS & BESYS lost days are recorded starting from the day right after the accident.
            • No occupational diseases are encountered in any of our companies in this report


    140
   135   136   137   138   139   140   141   142   143   144   145