Page 132 - BSR17-EN
P. 132

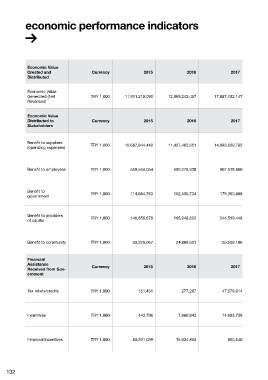
economic performance indicators


             Economic Value
             Created and                  Currency               2015               2016                2017
             Distributed


             Economic Value
             Generated (Net              TRY 1,000      11,911,210,090      12,969,243,457      17,087,182,147
             Revenues)


             Economic Value
             Distributed to               Currency               2015               2016                2017
             Stakeholders


             Benefit to suppliers
                                         TRY 1,000      10,687,844,442      11,407,462,651      14.983.629.785
             (operating expenses)


             Benefit to employees        TRY 1,000         559,554,054        699,278,938          907.918.860


             Benefit to                  TRY 1,000         114,664,763        152,535,734          179.360.806
             government


             Benefit to providers        TRY 1,000         146,856,678        165,948,620          244.519.448
             of capital


             Benefit to community        TRY 1,000          33,320,067         24,889,601           25.509.106


             Financial
             Assistance                   Currency               2015               2016                2017
             Received from Gov-
             ernment


             Tax reliefs/credits         TRY 1,000            151,451             277,287           47.579.014


             Incentives                  TRY 1,000            443,796           7,960,843           14.683.759


             Financial incentives        TRY 1,000          83,291,039         15,934,863             860.540


    132
   127   128   129   130   131   132   133   134   135   136   137