
Page 131 - B-SR-2016-EN
P. 131
[PERFORMANCE INDICATORS ]
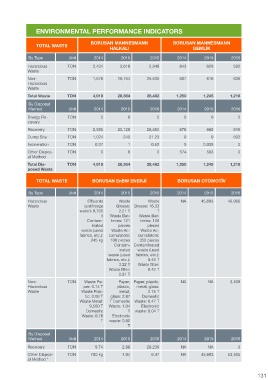
ENVIRONMENTAL PERFORMANCE INDICATORS
BORUSAN MANNESMANN BORUSAN MANNESMANN
ENVIRONMENTAL PERFORMANCE INDICATORS TOTAL WASTE
HALKALI GEMLİK
By Type Unit 2014 2015 2016 2014 2015 2016
Hazardous TON 2,431 3,610 2,948 643 629 582
Waste
TOTAL WASTE SUPSAN BORÇELİK & KERİM ÇELİK Non- TON 1,578 16,754 25,535 607 616 636
Hazardous
Waste
By Type Unit 2014 2015 2016 2014 2015 2016 Total Waste TON 4,010 20,364 28,482 1,250 1,245 1,218
By Disposal
Hazardous TON 415,922 237,990 393,860 1,111 1,921 2,926
Method Unit 2014 2015 2016 2014 2015 2016
Waste
Energy Re- TON 0 0 0 0 0 0
Non- TON 19,966 10,032 19,130 64,930 70,647 86,000
covery
Hazardous
Waste Recovery TON 2,985 20,120 28,460 676 662 616
Total Waste TON 435,888 248,022 412,990 66,041 72,568 88,926 Dump Site TON 1,024 243 21.23 0 0 602
By Disposal Incineration TON 0.37 1 0.62 0 0.039 0
Method Unit 2014 2015 2016 2014 2015 2016
Other Dispos- TON 0 0 0 574 583 0
al Method
Energy Re- Ton 9,250 41,240 NA 281 106 313
covery Total Dis- TON 4,010 20,364 28,482 1,250 1,245 1,218
posed Waste
Recovery Ton 398,272 170,764 412,975 64,686 72,255 88,253
Dump Site Ton 0 0 0 1,075 208 360
TOTAL WASTE BORUSAN EnBW ENERJİ BORUSAN OTOMOTİV
Incineration Ton 0 0 0 0 0
Other Dispos- Ton 28,366 36,018 15 0 0.025 By Type Unit 2014 2015 2016 2014 2015 2016
al Method
Hazardous Effluents Waste Waste NA 45,693 49,966
Total Dis- Ton 435,888 248,022 412,990 66,042 72,568 88,926 Waste (antifreeze Grease: Grease: 16.33
posed Waste water): 9,760 2.21 T
T
lt Waste Bat- Waste Bat-
Contam- teries: 121 teries: 106
BORUSAN MAKİNA inated pieces
pieces
TOTAL WASTE BORUSAN LOJİSTİK
VE GÜÇ SİSTEMLERİ waste (used Waste Ac- Waste Ac-
fabrics, etc.): cumulators: cumulators:
245 kg 100 pieces 350 pieces
By Type Unit 2014 2015 2016 2014 2015 2016 Contam- Contaminated
inated waste (used
Hazardous TON NA 239,950 182,472 22,861 17,476 11,619 waste (used fabrics, etc.):
Waste fabrics, etc.): 8.45 T
3.32 T
Waste filter:
Non- TON NA NA 244,503 269,835 123,415 120,538
Waste filter: 0.42 T
Hazardous
0.31 T
Waste
Non- TON Waste Pa- Paper, Paper, plastic, NA NA 3,439
Total Waste TON NA 239,950 426,975 292,696 140,891 132,157
Hazardous per: 0.14 T plastic, metal, glass:
By Disposal Waste Waste Plas- metal, 2.75 T
Method Unit 2014 2015 2016 2014 2015 2016 tic: 0.09 T glass: 2.87 Domestic
Waste Metal: T Domestic Waste: 6.47 T
Energy Re- TON NA 13,695 0 0 0 0 9,500 T Waste: 1.04 Electronic
covery Domestic T waste: 0.04 T
Waste: 0.78 Electronic
Recovery TON NA 0 416,753 269,835 123,415 120,538 T waste: 0.02
Dump Site TON NA 161,325 0 22,861 17,476 11,619 T
Incineration TON NA 0 10,222 0 0 0 By Disposal
Method Unit 2014 2015 2016 2014 2015 2016
Other Dispos- TON NA 64,930 0 0 0 0
al Method Recovery TON 9.74 2.88 28.239 NA NA 0
Total Dis- TON NA 239,950 426,975 292,696 140,891 132,157 Other Dispos- TON 780 kg 1.04 6.47 NA 45,693 53,405
posed Waste al Method *
NA: Data Not Available
130 131